
An app can build successfully and still calculate the wrong value, show stale content, or close when a user enters unexpected text. Android Studio provides tools for investigating these problems, but a tool becomes useful only when you know what question you want it to answer. A breakpoint can reveal a value. It cannot decide what that value should have been.
This guide follows a small study-planner calculation and then extends the investigation to crashes. The examples are intentionally independent of a particular screen design. You can connect the function to an existing button handler, inspect it while debugging your practice application, and move its behavior into local tests. Use a disposable learning project and synthetic inputs so your investigation does not involve personal information.
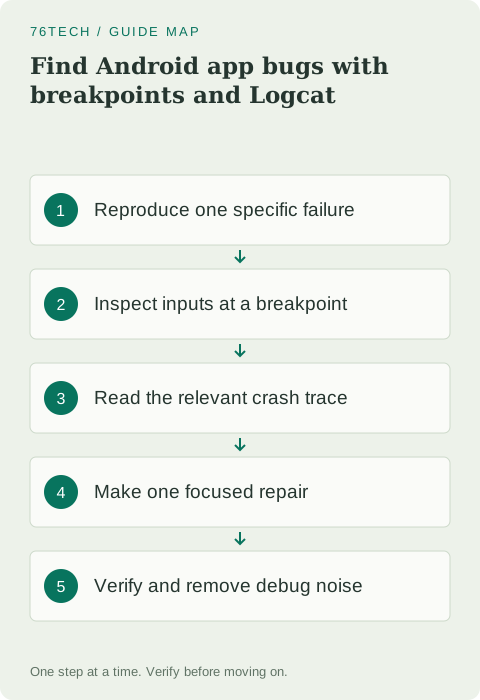
Write a reproduction that another person can follow
Begin by recording the starting screen, the exact input, and the action that triggers the problem. For our example, the user enters ten minutes of available study time and three minutes per task. The expected result is three complete tasks, with one minute remaining. The observed result is four tasks. That difference is precise enough to investigate without guessing about visual appearance.
Include the application build and device you used. If the bug appears only after returning from another screen, include that navigation step. If it occurs only after a restart, record the previous saved state. A reproduction that omits these details can send another developer toward a different execution path and create the misleading impression that the problem has disappeared.
Do not begin by changing the dependency versions, clearing every cache, and rewriting the screen. Those actions change several variables at once. First establish that the same steps produce the same failure twice. If the failure is intermittent, record when it occurs and when it does not. The contrast can reveal a useful condition, such as an empty input or a restored session.
Make the incorrect rule small enough to inspect
Here is a deliberately incorrect implementation. It counts any partial task as if it were complete. Place this function in your practice project and call it from an existing debug-only button action with the values ten and three. You should observe four. The function is pure Kotlin, which makes it easier to investigate separately from text fields and screen state.
fun plannedTasks(availableMinutes: Int, taskMinutes: Int): Int {
    val quotient = availableMinutes / taskMinutes
    val remainder = availableMinutes % taskMinutes
    return quotient + if (remainder > 0) 1 else 0
}
The arithmetic is not randomly broken. It implements a different rule: how many task slots would be needed to cover all available minutes if a partial slot counted. Naming the actual rule is important because it explains why the result looks plausible. Many application bugs arise from reasonable code answering the wrong question rather than from obviously invalid syntax.
For a debugging exercise, keep the function call visible and predictable. Do not place it directly in a composable body merely to trigger it repeatedly; screen recomposition could then confuse the number of calls you observe. Use an explicit event such as a button press, and keep the input values fixed until you have understood the calculation.
Pause before the decision, then inspect its inputs
Choose a debuggable build and the intended emulator or connected device. Place a breakpoint on the return statement and start a debugging session. Trigger the button once. When execution pauses, inspect the parameters and the two local values. In this example, quotient should be three and remainder should be one. Those observations explain exactly why the conditional adds another task.
Use stepping to follow a narrow question. Stepping over executes the current statement without following every nested call, while stepping into is useful when a called function contains the behavior you need to understand. Resume when you have finished inspecting the current stop. Button locations and keyboard shortcuts can vary with Studio versions and keymaps; use the named debugger actions rather than relying on a screenshot's exact coordinates.
The official Android Studio debugger guide documents session setup, breakpoints, and variable inspection. Treat inspection as evidence gathering. Record the values that support your explanation, then return to normal execution. Leaving an application paused for a long time can alter timing-sensitive behavior and make unrelated responsiveness symptoms harder to interpret.
Distinguish wrong data from a wrong calculation
Imagine that the breakpoint instead shows availableMinutes equal to one hundred. In that case, changing the division formula would not address the observed input problem. Move your investigation upstream to the conversion from the text field, a default value, or restored state. Inspect the value at the boundary where the interface hands data to the calculation.
Likewise, if the function returns three but the screen displays four, examine the code that stores and renders the result. There may be a previous value, another event handler, or an additional transformation. Divide the path into input, calculation, state update, and display. Compare expected and actual values at each boundary until you locate the first divergence.
This boundary-based approach keeps the debugging session manageable. You do not need to understand every file in the application before finding one wrong transition. Write a short note after each observation: input correct, calculation correct, state incorrect. That note makes it easier to resume the investigation after an interruption and avoids repeating steps that already answered a question.
Use Logcat when the application closes
Now consider a different input: zero minutes per task. The original function divides by zero and can throw an arithmetic exception. A crash investigation begins with the relevant exception and its stack trace, not with the last unrelated warning visible in a busy log window. Select the appropriate device and application process before reproducing the failure.
Logcat supports queries that narrow the visible messages. Use the application's package and the relevant severity or tag to reduce noise. Keep enough context to see the beginning of the exception and any causal chain. The Logcat documentation describes its filtering and navigation controls. Save the relevant excerpt rather than copying an entire device log containing unrelated activity.
A stack trace is a path through the failing execution. Look for frames that belong to your application and connect them to the input you supplied. A framework frame near the top is not automatically the place you should edit. In this example, your calculation is the important boundary because it accepted a divisor that the feature never defined as valid.
Repair the contract and handle invalid input deliberately
The corrected function counts complete tasks and rejects invalid arguments. It accepts zero available minutes because that has a sensible result. It requires a strictly positive duration per task because a zero or negative duration has no meaning in this feature. These are domain decisions, and the error messages should make those decisions visible to the developer.
fun completedTaskCapacity(
    availableMinutes: Int,
    taskMinutes: Int
): Int {
    require(availableMinutes >= 0) { "Available time cannot be negative" }
    require(taskMinutes > 0) { "Task duration must be positive" }
    return availableMinutes / taskMinutes
}

fun verifyCapacity() {
    check(completedTaskCapacity(10, 3) == 3)
    check(completedTaskCapacity(9, 3) == 3)
    check(completedTaskCapacity(2, 3) == 0)
    check(completedTaskCapacity(0, 3) == 0)
    println("Capacity checks passed")
}
At the interface boundary, validate user-entered text before calling this function. For example, a failed integer conversion should produce an actionable field message rather than an exception displayed to the reader. Keep the function's validation as a second boundary for programmer mistakes. Simply catching every exception and returning zero would conceal a different class of problem and make debugging harder next time.
The checks above intentionally use independent expected values. Do not calculate the expected result by copying the same expression as the implementation. That would allow the same misunderstanding to exist on both sides of the assertion. Explain each expected value in ordinary language first, then encode it as a check or a test-framework assertion.
Verify without the debugger changing the experience
After the repair, repeat the original reproduction with the debugger detached. Confirm that ten minutes and three minutes per task now produce three complete tasks. Then exercise the exact boundary, a duration larger than the available time, and zero available time. Finally, enter invalid text through the interface and verify that the user receives a clear correction message.
Try the navigation and restart steps from your original report. A calculation fix does not automatically solve a stale result restored from storage. If old values remain visible, investigate that issue as a separate state-management concern. Keep the scope of the repair understandable so reviewers can distinguish the fixed calculation from any remaining interface behavior.
Move the pure calculation cases into the project's local test suite when the feature is retained. The purpose is to protect the business rule, not to preserve the exact implementation. A future refactor may use a different internal structure while still returning the same correct results. Tests should make that safe change possible instead of requiring the old code to remain unchanged.
Leave an explanation that helps the next investigation
Before finishing, remove temporary logging that no longer serves a purpose and review any remaining messages for sensitive content. A useful development message might state that input validation failed; it rarely needs the user's entire note or account details. Keep permanent diagnostics focused on events that help distinguish failure modes.
Your change description should connect the trigger, cause, repair, and verification. For example, entering a study time that is not divisible by task duration previously counted a partial task as complete. The calculation now counts only whole tasks, and boundary cases verify zero time, exact division, and insufficient time. That account is more valuable than saying that several debugger settings were adjusted.
For a final exercise, change the requirement to reserve two minutes for setup before calculating capacity. Decide what happens when the available time is shorter than setup. Write examples before modifying the function, then inspect one case in the debugger and verify the rest independently. You are practicing a repeatable investigation method: establish the expected behavior, observe the first divergence, make a focused repair, and confirm the result.